
AMERICAN PREPAREDNESS STATISTICS 2027
American Preparedness Statistics 2027
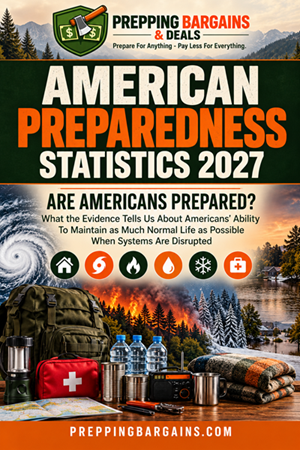
Free PDF • 2027 Edition
Get the Free 2027 American Preparedness Statistics Report
A practical, research-based look at how prepared American households really are for disruptions to everyday life — compiled from federal data, national surveys, and peer-reviewed studies.
Are Americans Prepared?
What the evidence tells us about Americans’ ability to maintain as much normal life as possible when normal systems are disrupted.
How prepared are American households for a disaster, extended power outage, supply-chain interruption, or other disruption to everyday life?
The answer is more complicated than a single percentage.
Americans are taking preparedness steps. Many report keeping emergency supplies, making plans, and taking other actions to protect their households. But having supplies is not the same as knowing how long they will last. Owning a generator does not necessarily mean a household can operate it safely or keep essential equipment running. And having a plan does not guarantee that it will work when normal services are unavailable.
The PreppingBargains American Preparedness Statistics 2027 report brings together federal statistics, national surveys, university research, peer-reviewed studies, and official guidance to examine what Americans are doing to prepare—and what the available evidence can actually tell us.
This report looks beyond the usual emergency-kit checklist. It examines food, water, power, finances, medical needs, transportation, communications, household resources, and the ability to maintain essential functions when everyday systems are disrupted.
The goal is straightforward: understand where American preparedness stands, what the research shows, and where important gaps remain.
Free report from PreppingBargains.com.
Key Findings: What the Research Shows
The report brings together several different measures of preparedness. These findings are not parts of one overall score; each measures a different aspect of household readiness.
1. Many Americans report taking preparedness steps.
FEMA’s 2024 National Household Survey on Disaster Preparedness found that:
- 83% of respondents reported taking at least three preparedness actions.
- 69% reported having emergency supplies.
These figures show widespread preparedness activity, but they do not establish that households can sustain essential needs during a prolonged disruption.
2. Emergency supply duration varies considerably.
Among respondents who reported having emergency supplies:
- 88% said their supplies would last more than three days.
- 61% reported more than one week.
- 34% reported more than two weeks.
- 18% reported more than one month.
- 8% reported more than three months.
These percentages apply only to respondents who said they had supplies—not to all American households.
3. Concern about disasters is greater than confidence in preparedness.
The 2026 United Way preparedness survey snapshot reported:
- 60% were concerned a natural disaster could affect their household within the next 12 months.
- 15% felt very prepared.
- 16% had created and tested a household emergency plan.
These are separate survey questions, but together they illustrate the difference between concern and completed preparation.
4. Power outages affect millions of households.
The U.S. Census Bureau’s 2023 American Housing Survey found that 33.9 million households experienced a complete power outage during the previous 12 months. Among households reporting an outage, approximately 23.6 million reported at least one outage lasting six hours or more.
Power interruptions can affect food storage, work, heating and cooling, water systems, communications, and medical equipment.
5. Financial preparedness is another part of household resilience.
The Federal Reserve’s 2025 Survey of Household Economics and Decisionmaking, published in May 2026, reported:
- 63% of adults could cover a hypothetical $400 expense using cash, savings, or a credit card paid off at the next statement.
- 12% said they could not pay that expense by any means.
- 55% reported having rainy-day savings sufficient to cover three months of expenses.
These are separate financial measures, not parts of a single distribution.
6. A single national preparedness percentage does not tell the whole story.
The research does not establish one validated percentage of Americans who are fully prepared. Surveys measure different populations, questions, resources, and actions. They do not all measure whether a household can maintain essential functions, for how long, or what alternatives are available when the first solution fails.
That distinction is central to this report.
If you are a media outlet, please visit our page with all the print-ready graphics and attributes at American Preparedness Statistics Media and Resources.
What’s Inside the Report?
The 2027 report examines preparedness from several angles, including the reasons people prepare, the disruptions households face, and the resources needed to maintain everyday life.
Table of Contents
Introduction
- How to Read This Report
The Research
- Are Americans Prepared?
- What Is Driving Americans to Prepare?
- Disasters and Extreme Weather
- War, Geopolitical Risk and Civil Preparedness
- Inflation, Food Prices and Economic Preparedness
- How Many Americans Are Preppers—and Does the Label Matter?
- The Growth of the Preparedness Industry
- Emergency Food Storage
- Growing Food at Home
- Emergency Water
- Backup Power, Generators, Batteries and Solar
- Medication and Medical Preparedness
- Older Adults and Emergency Preparedness
- Pet Preparedness
- Bunkers, Shelters and Safe Rooms
- Self-Sufficiency and Homesteading
- Emergency Communications
- The Future of American Preparedness—2030
Conclusion
- Are Americans Prepared?
Research and Documentation
- References and Research Notes
- Interpretation and Limitations
- Methodology: How to Interpret the Evidence
- A Closer Look at One Household Preparedness Study
How We Researched This Report
The American Preparedness Statistics 2027 report compiles existing published information. It is not a new nationally representative survey conducted by PreppingBargains.
Research draws on sources including:
- Federal agencies such as FEMA, the U.S. Census Bureau, the Federal Reserve, the CDC, and the USDA.
- University research and Cooperative Extension publications.
- Peer-reviewed studies published in academic journals.
- National surveys and research organizations.
- Official emergency-management and public-safety guidance.
We evaluate each statistic in the context of its original source. We look at the publication date, data period, population, denominator, question wording or operational definition, and the type of evidence being reported.
We also distinguish between observed data, survey responses, estimates, forecasts, case studies, and official recommendations. Those categories answer different questions and should not be treated as interchangeable.
Our standard is simple: a statistic should be traceable to its source, and its meaning should not be stretched beyond what the original research supports.
Important Limitations
Preparedness is difficult to measure because it involves more than owning supplies or completing a checklist.
A household may have food stored but lack the water or fuel needed to prepare it. A generator may be available but unable to support critical household equipment for an extended period. A household may have an emergency plan that has never been tested.
The research in this report also comes from different years, populations, survey methods, and definitions. A percentage describing adults cannot automatically be applied to households. A statistic describing people who experienced an outage cannot be treated as a percentage of all Americans.
For these reasons:
- Interpret the findings using the original source’s population and denominator.
- Survey responses describe what people reported, not necessarily what independent testing found.
- Official guidance describes recommended actions, not proof that households have followed them.
- Forecasts describe possible future conditions, not observed outcomes.
- The report does not assign one national percentage of Americans who are fully prepared because the available evidence does not establish a validated national measure of household preparedness capability.
These qualifications are important. They help make the report more useful, not less.
Explore the Original Research
Readers who want to check a finding or explore the underlying research can use the references and research notes included in the report.
The report identifies the original sources behind its major findings, including:
- FEMA’s National Household Survey on Disaster Preparedness.
- United Way’s 2026 preparedness survey.
- U.S. Census Bureau data from the American Housing Survey.
- The Federal Reserve’s Report on the Economic Well-Being of U.S. Households.
- CDC emergency water, medical, and safety guidance.
- USDA food-security and food-price research.
- Purdue University food production and consumer research.
- Peer-reviewed household preparedness research published in JAMA Network Open.
Source notes and citations are provided throughout the report, with full references and research notes at the end.
If you are a media outlet, please visit our page for print-ready graphics and attributes at American Preparedness Statistics Media and Resources.
Read the Full Series
The report is backed by ten companion articles that put these findings to work. Each one keeps the data and adds the practical steps for your household.
- Understanding the Preparedness Gap
- Power Outages and Medical Preparedness
- How Much Emergency Water Should You Store?
- Growing Food for Household Security
- Prescription Medications During Disasters
- How to Prepare Your Pets for a Disaster
- How to Prepare for a Two-Week Power Outage
- Why Older Adults Face Different Preparedness Challenges
- Safe Room vs. Storm Shelter vs. Bunker
- Emergency Communications: Alerts, Radios and Backup Contact Plans
You can also browse the full American Preparedness Research archive.
Download the Full Report
American Preparedness Statistics 2027: Are Americans Prepared?
Find out what the research says about emergency supplies, power outages, financial resilience, food and water, medical preparedness, and the ability of American households to maintain essential needs during disruptions.
Research compiled and published by PreppingBargains.com.
Cite This Report
If you use information, statistics, or charts from this report in an article, publication, presentation, research project, or other material, please cite the report and the original source identified for the specific finding.
PreppingBargains.com. (2026). American Preparedness Statistics 2027: Are Americans Prepared? PreppingBargains.com. https://preppingbargains.com/american-preparedness-statistics
When citing an individual statistic, please also cite the original source listed in the report. This helps readers locate the underlying data and understand the population, year, and measurement used.
PreppingBargains.com
Prepare For Anything – Pay Less For Everything.