
American Preparedness Media and Research Resources
PreppingBargains.com • Research
Media & Research Resources
American Preparedness Statistics 2027
Statistics, approved charts, source information, and research materials for journalists and publishers. Everything here is free to use with the attribution shown on each chart.
Free PDF • 2027 Edition
Quick Links
About the Research
American Preparedness Statistics 2027 compiles federal statistics, national surveys, university research, and peer-reviewed studies on how prepared American households are for disruptions to everyday life. It is a compilation of existing published information, not a new survey conducted by PreppingBargains.
This page gives journalists, researchers, and publishers the charts and source information from the report in a form that is easy to cite and verify. Each chart below links to a plain-text file with its exact source, population, data year, required attribution, and caveats. Read the full report for context: American Preparedness Statistics 2027.
Approved Chart Library
These charts are free for editorial and research use with the attribution shown in each chart’s source notes. Download the PNG and its matching source-and-attribution file. Please keep each statistic with its stated population and caveats — several figures apply only to a sub-group, not to all U.S. households. The final graphic is a PreppingBargains conceptual framework, not survey data.
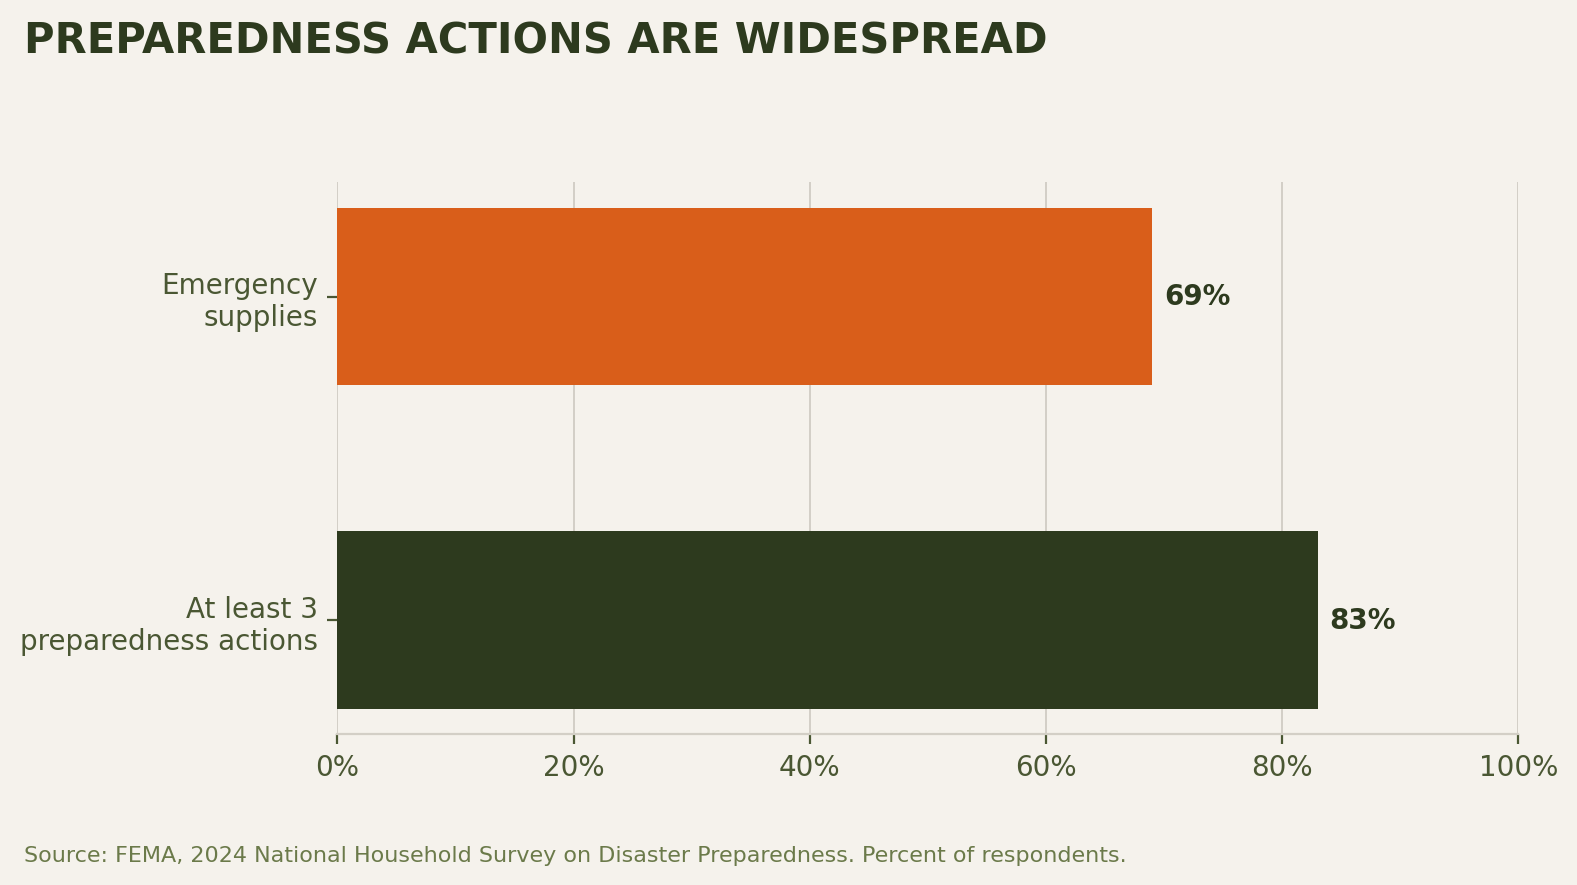
Preparedness Actions Are Widespread
Source: FEMA · 2024 National Household Survey

Preparedness Depth Falls as Duration Increases
Source: FEMA · 2024 National Household Survey
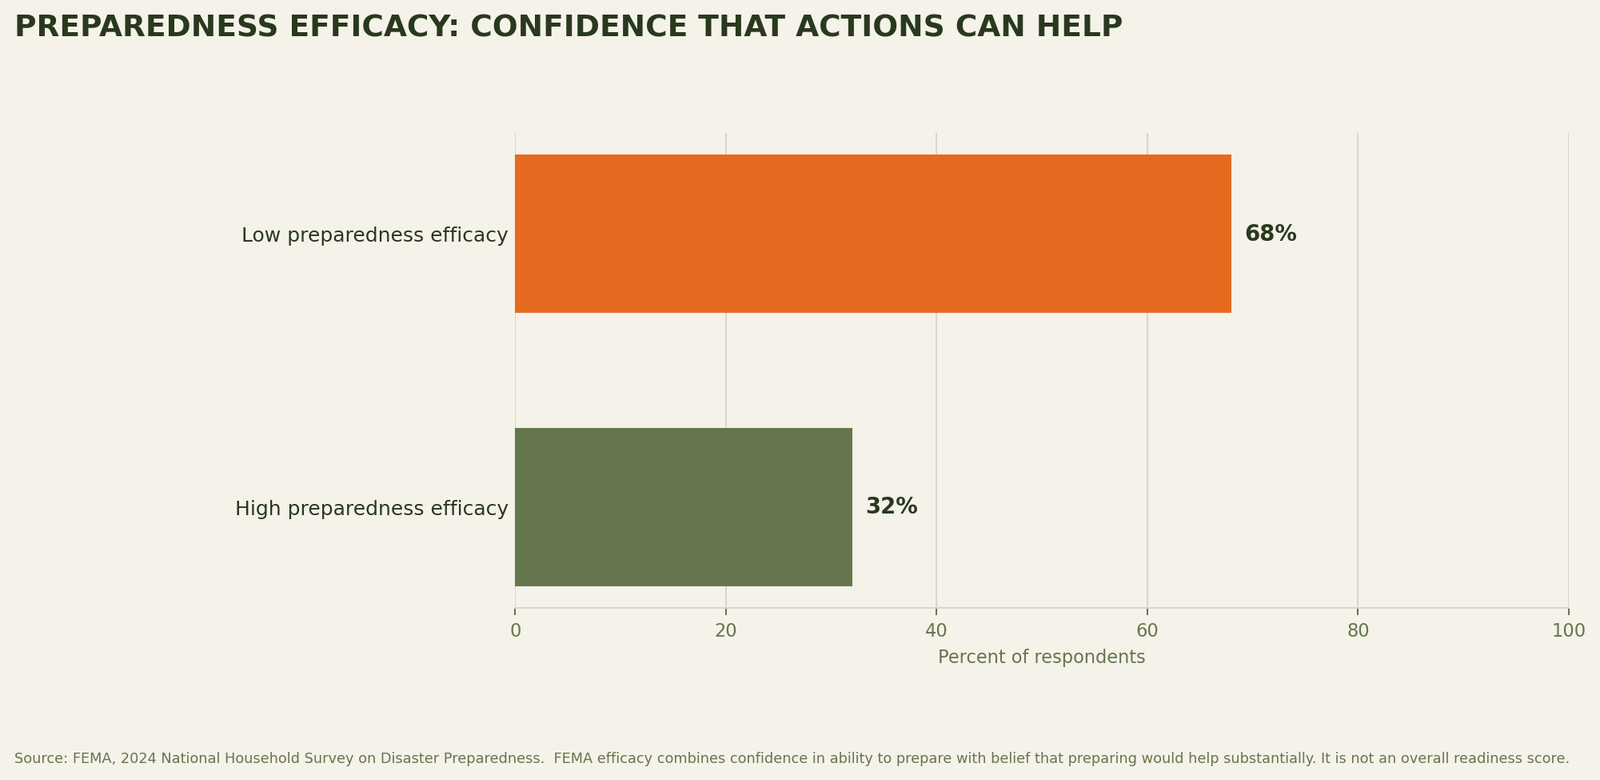
Preparedness Efficacy: Confidence That Actions Can Help
Source: FEMA · 2024 National Household Survey
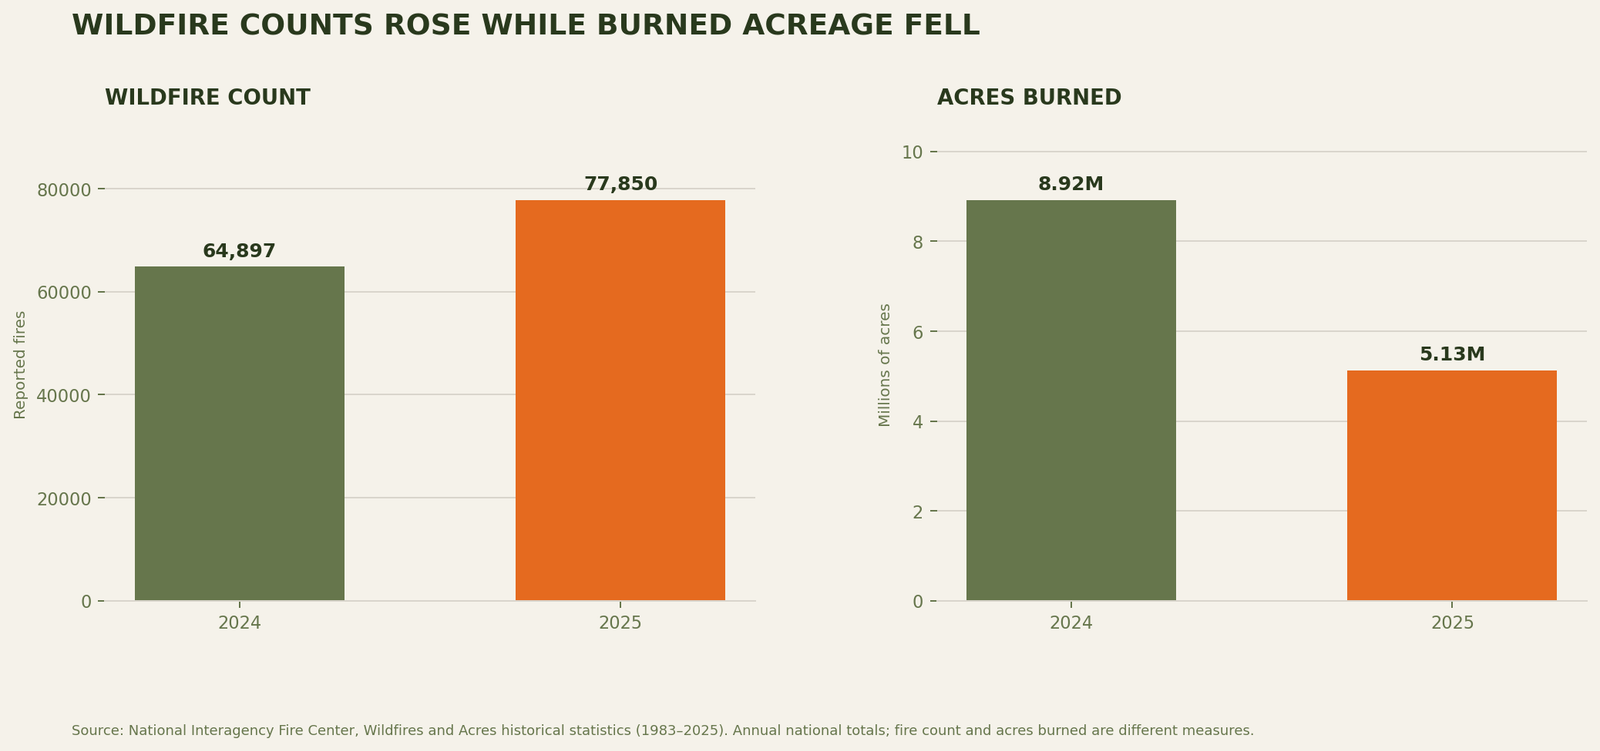
Wildfire Counts Rose While Burned Acreage Fell
Source: National Interagency Fire Center · 2024–2025

Power Outages Affect Millions of Households
Source: U.S. Census Bureau · 2023 American Housing Survey
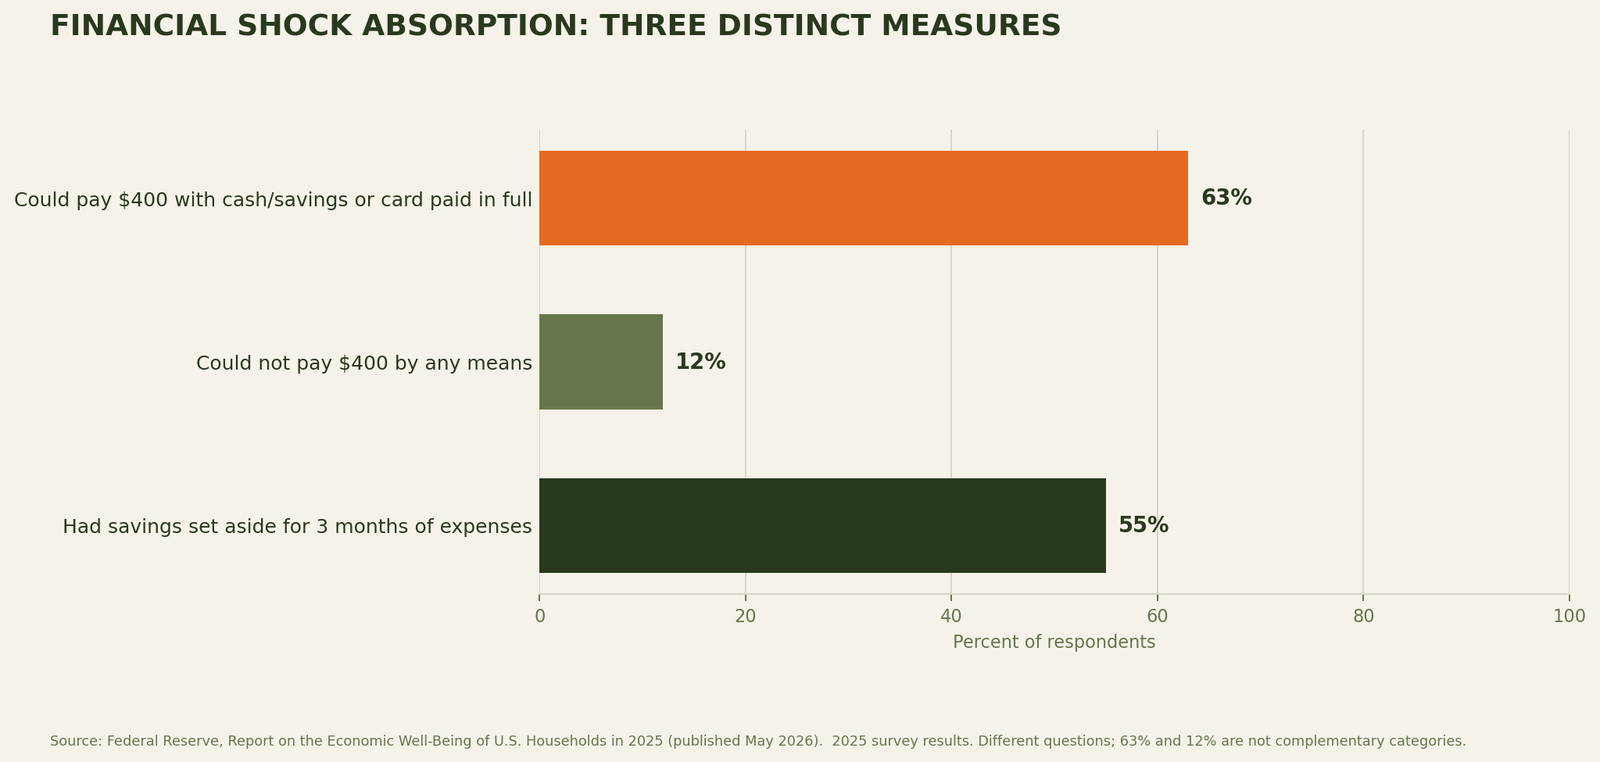
Financial Shock Absorption: Three Distinct Measures
Source: Federal Reserve (SHED) · 2025

Home Food Production and Gardening
Source: Purdue University (CFDAS) · 2025

Households Using Electricity-Dependent Medical Devices
Source: U.S. Census Bureau · 2023 American Housing Survey

Selected Preparedness Actions by Age
Source: FEMA · 2024 National Household Survey

Pet Evacuation Intention Does Not Guarantee Capability
Source: ASPCA · 2021 survey of pet owners
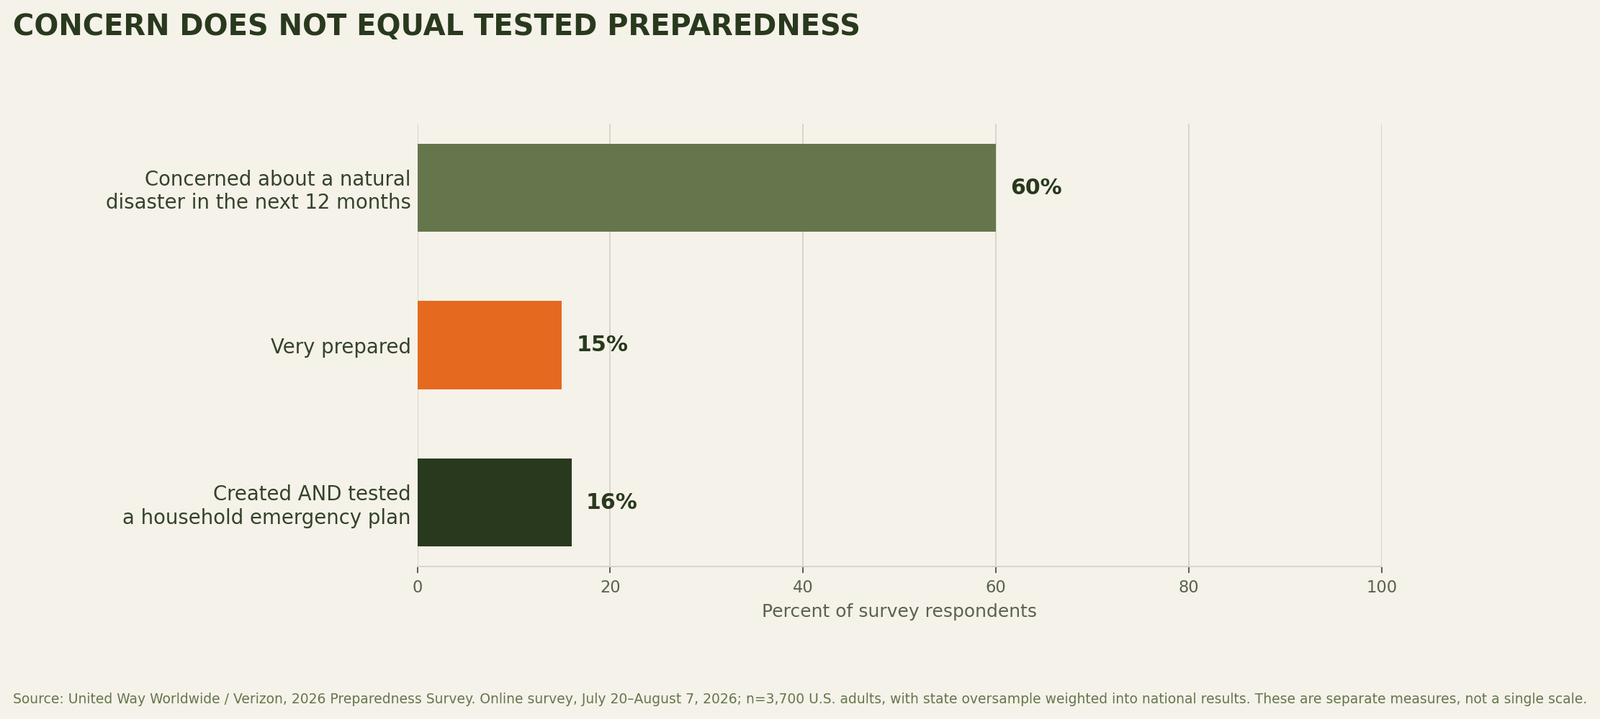
Concern Does Not Equal Tested Preparedness
Source: United Way / Verizon · 2026
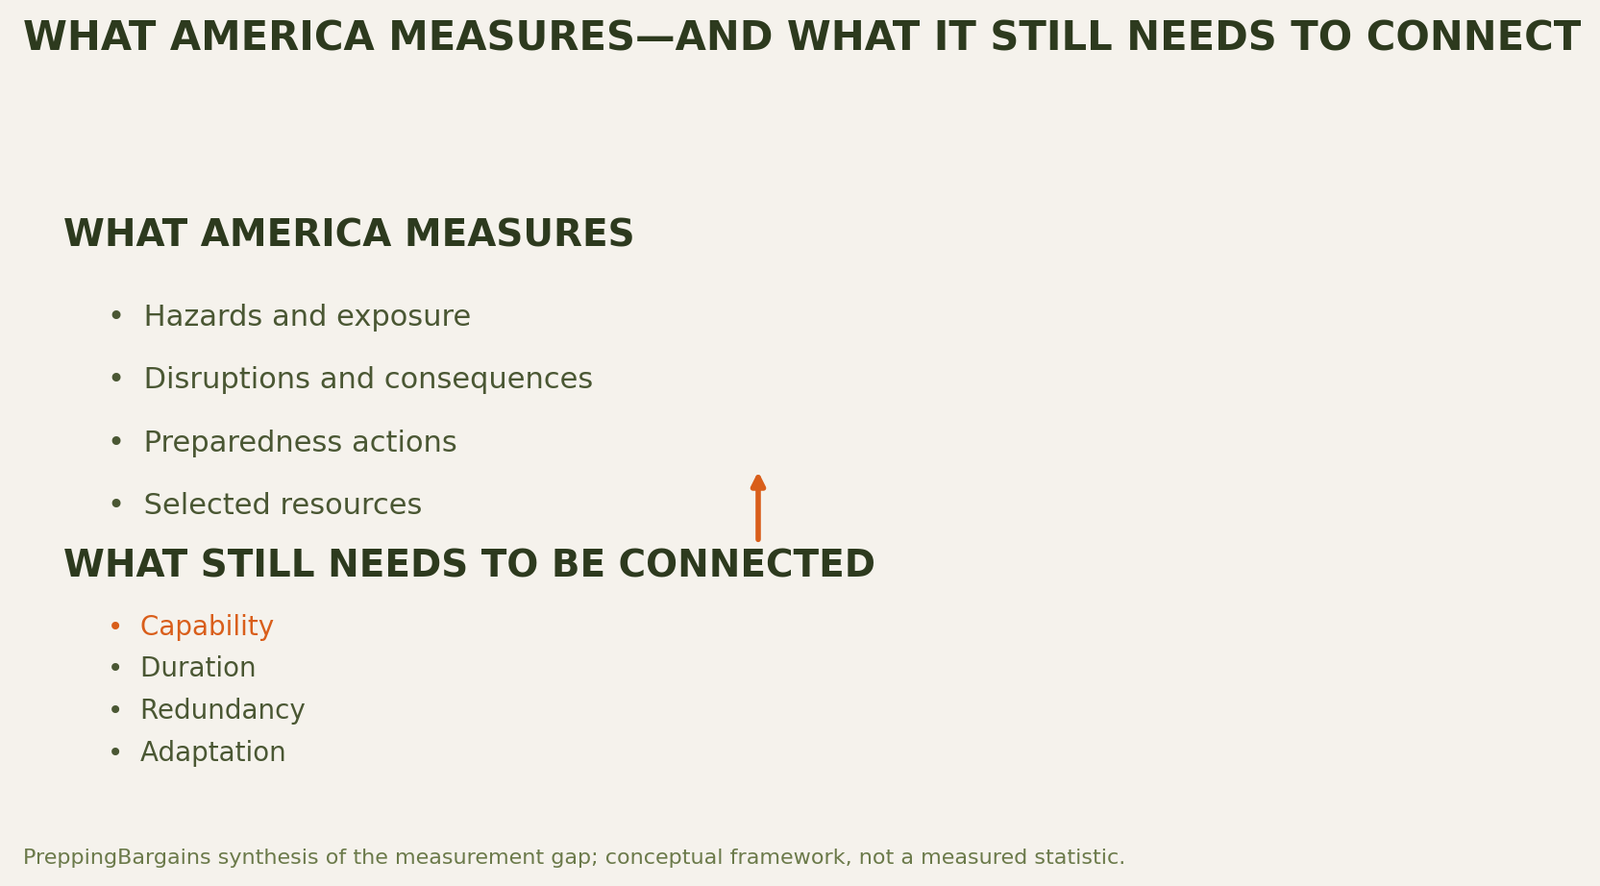
What America Measures and What It Still Needs to Connect
PreppingBargains conceptual framework — not survey data
Key Statistics
83%
Reported taking at least three preparedness actions. Source: FEMA, 2024 National Household Survey (published 2025). Separate measure — not an overall preparedness rating.
69%
Reported having emergency supplies. Source: FEMA, 2024 National Household Survey (published 2025).
33.9 million
U.S. households experienced a complete power outage in the previous 12 months. Source: U.S. Census Bureau, 2023 American Housing Survey.
Research Downloads
- Full report (PDF): American Preparedness Statistics 2027
- Report overview page: Read the report online
- Individual charts: each chart in the library above includes a PNG download and a source-and-attribution file.
Methodology & Limitations
Each statistic is evaluated in the context of its original source — its publication date, data period, population, denominator, question wording, and the type of evidence reported. Observed data, survey responses, estimates, forecasts, and official recommendations are kept distinct, because they answer different questions.
Several important limits apply: survey percentages describing adults cannot be applied to households; figures describing a sub-group (for example, people who reported an outage) are not percentages of all Americans; and the report does not assign one national percentage of Americans who are “fully prepared,” because the evidence does not establish a validated national measure. The full report details each source and its caveats.
Contact
Need research information?
Contact us for original sources, survey details, charts in another format, or interview inquiries.